TGOFNAU ID
Thornburg Global Opportunities Fund (UCITS)
Fund Assets
$75.4 M
As of 30 Sep 2026
NAV
$16.41
As of 22 Oct 2026
Change
$-0.15
As of 22 Oct 2026
YTD NAV Performance
6.21%
As of 22 Oct 2026
Asset Category:
Global Equity
Fund Benchmark:
MSCI ACWI Index
Portfolio Managers
Vice Chairman, Chief Investment Strategist, Portfolio Manager and Managing Director
Portfolio Manager and Managing Director
An Introduction to
Global Opportunities
Two decades. One consistent philosophy.
A world of opportunity.
Hear what this milestone means to Portfolio Manager Miguel Oleaga.
Overview
Overview
Why Invest in This Fund?
- A flexible, focused equity portfolio seeking investment opportunities from around the globe and across market capitalizations.
- A proven fundamental research process to identify and select quality, undervalued businesses with a defined path to success and value creation.
- The fund seeks to outperform global equity markets over a full market cycle.
Investment Objective
The fund’s goal is to provide investors with long-term capital appreciation by investing in equity and debt securities of all types from issuers around the world.
Investment Approach
The fund has the flexibility to seek investment opportunities from around the world and across market capitalization. It employs a fundamental, bottom-up investment process to identify companies that we believe have quality business models, trading at a discount to long-term intrinsic value, and have a defined path to success. The portfolio typically holds 30-40 securities and is diversified across countries and sectors.
Related Content

Fund Facts
Fund Facts
(As of 30 Sep 2026)Net Fund Assets
$75.4 M
Benchmark
MSCI ACWI Index
Morningstar Category
EAA Fund Global Large-Cap Blend Equity
Distribution Frequency
N/A
SFDR
Article 8
Minimum Investment
$1,000
Ongoing Charges
2.25%
Management Fee
2.00%
Share Class
N Acc
Share Class Inception Date
3 Jan 2024
Fund Inception Date
11 Jan 2011
Bloomberg Ticker
TGOFNAU ID
ISIN
IE0003PN6QX8
Cusip
G8850N205
SEDOL
03PN6QX
Performance
Performance
Returns
(As of 30 Sep 2026)2025
Total Return (%)
37.46
MSCI ACWI Index (%)
22.34
Hypothetical Growth of $10,000
Hypothetical Growth of $10,000
(As of 31 Dec 2023)
(Hypothetical Growth of $10,000 vs MSCI ACWI Index)
Characteristics
Characteristics
Portfolio
(As of 30 Sep 2026)Portfolio
Benchmark
Number of Holdings
40
—
Weighted Average Market Cap
$523.2 B
$1,146.0 B
Median Market Cap
$118.3 B
$18.8 B
Annual Portfolio Turnover
14%
—
Price to Earnings - Forward 1YR
12.7x
17.8x
Portfolio
Benchmark
Dividend Yield
1.8%
1.5%
Price to Earnings - Trailing 12 Months
19.4x
24.5x
Price to Cash Flow
9.3x
15.5x
Price to Book Value
2.7x
3.8x
Active Share
89.7%
—
Risk & Return Profile
Risk & Return Profile
(As of 30 Sep 2026)3y
5y
10y
Annualized Alpha (%)
4.27
2.86
-0.11
Beta
0.88
0.89
1.02
R-Squared (%)
70.87
79.16
83.22
Standard Deviation (%)
12.46
14.81
16.46
Sharpe Ratio
1.53
0.63
0.59
Information Ratio
0.31
0.24
-0.02
Tracking Error (%)
6.86
6.95
6.75
Up Capture (%)
103.48
98.22
100.74
Down Capture (%)
91.10
88.12
101.89
Portfolio
Portfolio
Top Holdings
(As of 30 Sep 2026)Name
Ticker/Symbol
Sector
Weight %
Samsung Electronics Co. Ltd.
005930
Information Technology
6.3
Eli Lilly & Co.
LLY
Health Care
5.1
SAP SE
SAP
Information Technology
4.3
Alphabet, Inc.
GOOGL
Communication Services
4.0
Adobe, Inc.
ADBE
Information Technology
3.7
MTU Aero Engines AG
MTX
Industrials
3.6
Zegona Communications plc
ZEG
Communication Services
3.4
CACI International, Inc.
CACI
Industrials
3.3
Taiwan Semiconductor Manufacturing Co. Ltd.
2330
Information Technology
3.3
The Charles Schwab Corp.
SCHW
Financials
3.2
Exposure Breakdown
Exposure Breakdown
(As of 30 Sep 2026)Sector Allocation
Fund (%)
Communication Services
20.9
Information Technology
17.6
Industrials
14.1
Financials
12.9
Consumer Discretionary
11.6
Cash & Equivalents
6.6
Health Care
5.8
Energy
3.9
Materials
3.3
Consumer Staples
3.2
Real Estate
0.0
Utilities
0.0
Top 10 Industries
Fund (%)
Media & Entertainment
12.0
Telecommunication Services
8.9
Capital Goods
8.0
Software & Services
8.0
Consumer Services
7.1
Banks
6.6
Technology Hardware & Equipment
6.3
Commercial & Professional Services
6.0
Pharmaceuticals, Biotechnology & Life Sciences
5.8
Financial Services
4.7
Top 10 Countries
Fund (%)
United States
34.4
Germany
8.8
China
8.5
France
8.4
Korea, Republic of (South Korea)
6.3
United Kingdom
4.6
Hong Kong
4.2
Taiwan
4.0
Ireland
2.8
Japan
2.8
Capitalization
Fund (%)
Large Cap (> $12 B)
84.1
Mid Cap ($2.5 to $12 B)
11.1
Small Cap (< $2.5 B)
4.8
Portfolio Managers
Portfolio Managers

Brian McMahon
Vice Chairman, Chief Investment Strategist, Portfolio Manager and Managing Director
Brian McMahon is chief investment strategist and a portfolio manager for Thornburg Investment Management. Brian is deeply respected for his market and investment insight and serves as a key voice for the investment team and Thornburg clients. He also co-manages Thornburg’s global equity portfolios and serves as vice chairman of Thornburg. Brian joined Thornburg in 1984 as chief investment officer;…
Learn More
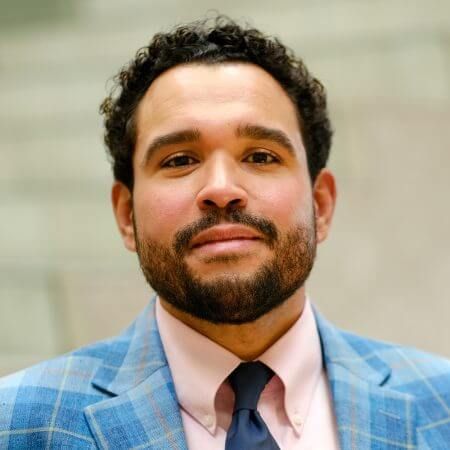
Miguel Oleaga
Portfolio Manager and Managing Director
Miguel Oleaga is a portfolio manager for Thornburg Investment Management. He joined the firm in 2014 as an equity research analyst, was promoted to associate portfolio manager in 2017, and was named portfolio manager in 2018. Miguel holds a BS in business administration (finance and management specialties) from the University of Massachusetts. Prior to his joining Thornburg, Miguel worked at…
Learn More
More Insights

Global Equity
Reflecting On the Anniversary of Thornburg Global Opportunities Fund
An interview with Miguel Oleaga, Portfolio Manager

Global Equity
Quality Without Dogma: Why Valuation Still Matters
Is quality investing broken, or have investors simply paid too much for it? This article explores why Thornburg believes quality and valuation discipline are inseparable, and why flexibility remains essential to long-term investing.
Markets & Economy
Signal Over Noise: A Conversation on Global Markets
At Thornburg, we separate signal from noise in today's global markets, sharing how active, high-conviction research shapes portfolio decisions across countries and sectors.