THCCX
Thornburg Core Plus Bond Fund
Fund Assets
$96.1 M
As of 31 Mar 2026
NAV
$10.47
As of 22 Apr 2026
Change
$0.01
As of 22 Apr 2026
YTD NAV Performance
0.41%
As of 22 Apr 2026
Asset Category:
Global Fixed Income
Fund Benchmark:
Bloomberg U.S. Aggregate Index
Portfolio Managers
Portfolio Manager and Managing Director
Head of Fixed Income, Portfolio Manager and Managing Director
Overview
Overview
Why Invest in This Fund?
- Extension of Our Successful Fixed Income Platform – Thornburg has been managing fixed-income portfolios for over 40 years and is currently entrusted with more than $22B in fixed income client assets.
- Conservative Investment Philosophy – Clients have been burned in the past as some managers chase high returns by taking on additional risk. Our approach is to take on risk only when we believe we will be compensated for doing so.
- Portfolio Transparency – Some competitors use a large amount of rate and credit derivatives. With the Thornburg Core Plus Fund, you’ll know what you own.
Investment Objective
The Fund seeks to maximize total return, consistent with the long-term preservation of capital.
Investment Approach
The fund is an actively managed strategy that seeks income and total return greater than core bonds, with a similar volatility as core. The fund will invest primarily in investment-grade bonds and up to 25% in securities rated below investment grade. We believe our unique, unsiloed approach to security analysis allows us to uncover relative value across different investments that many competitors may miss.
Related Content
Performance
Performance
Returns
(As of 31 Mar 2026)2020
2021
2022
2023
2024
2025
Total Return with Sales Charge (%)
—
—
—
—
-0.34
5.64
Total Return without Sales Charge (%)
—
—
—
—
0.63
6.64
Bloomberg U.S. Aggregate Index (%)
—
—
—
—
1.25
7.30
Fund Fees
Fund Fees
(As of 1 Feb 2026)
Gross Expense Ratio (%)
3.61
Net Expense Ratio (%)
1.50
Hypothetical Growth of $10,000
Hypothetical Growth of $10,000
(As of 31 Mar 2026)
(Hypothetical Growth of $10,000 vs Bloomberg U.S. Aggregate Index)
Distributions
Distributions
(As of 31 Mar 2026)Ex-Date
Payable Date
Total ($)
Income ($)
ST Cap Gains ($)
LT Cap Gains ($)
31 Jan 2023
31 Jan 2023
0
—
—
—
28 Feb 2023
28 Feb 2023
0
—
—
—
31 Mar 2023
31 Mar 2023
0
—
—
—
30 Apr 2023
30 Apr 2023
0
—
—
—
31 May 2023
31 May 2023
0
—
—
—
30 Jun 2023
30 Jun 2023
0
—
—
—
31 Jul 2023
31 Jul 2023
0
—
—
—
31 Aug 2023
31 Aug 2023
0
—
—
—
30 Sep 2023
30 Sep 2023
0
—
—
—
31 Oct 2023
31 Oct 2023
0
—
—
—
30 Nov 2023
30 Nov 2023
0.03324
0.03324
—
—
29 Dec 2023
31 Dec 2023
0.03326
0.03326
—
—
31 Jan 2024
31 Jan 2024
0.02941
0.02941
—
—
29 Feb 2024
29 Feb 2024
0.02915
0.02915
—
—
28 Mar 2024
31 Mar 2024
0.03141
0.03141
—
—
30 Apr 2024
30 Apr 2024
0.03484
0.03484
—
—
31 May 2024
31 May 2024
0.04207
0.04207
—
—
28 Jun 2024
30 Jun 2024
0.03978
0.03978
—
—
31 Jul 2024
31 Jul 2024
0.03840
0.03840
—
—
30 Aug 2024
31 Aug 2024
0.03704
0.03704
—
—
30 Sep 2024
30 Sep 2024
0.03594
0.03594
—
—
31 Oct 2024
31 Oct 2024
0.03414
0.03414
—
—
21 Nov 2024
21 Nov 2024
0.01431
—
0.01431
0.00000
29 Nov 2024
30 Nov 2024
0.03435
0.03435
—
—
31 Dec 2024
31 Dec 2024
0.03452
0.03452
—
—
31 Jan 2025
31 Jan 2025
0.03412
0.03412
—
—
28 Feb 2025
28 Feb 2025
0.03393
0.03393
—
—
31 Mar 2025
31 Mar 2025
0.03638
0.03638
—
—
30 Apr 2025
30 Apr 2025
0.03521
0.03521
—
—
30 May 2025
31 May 2025
0.03557
0.03557
—
—
30 Jun 2025
30 Jun 2025
0.03497
0.03497
—
—
31 Jul 2025
31 Jul 2025
0.03514
0.03514
—
—
29 Aug 2025
31 Aug 2025
0.03567
0.03567
—
—
30 Sep 2025
30 Sep 2025
0.03462
0.03462
—
—
31 Oct 2025
31 Oct 2025
0.03597
0.03597
—
—
28 Nov 2025
30 Nov 2025
0.03489
0.03489
—
—
31 Dec 2025
31 Dec 2025
0.03387
0.03387
—
—
30 Jan 2026
31 Jan 2026
0.03139
0.03139
—
—
27 Feb 2026
28 Feb 2026
0.01421
0.01421
—
—
31 Mar 2026
31 Mar 2026
0.03713
0.03713
—
—
Fund Facts
Fund Facts
(As of 31 Mar 2026)Net Fund Assets
$96.1 M
Benchmark
Bloomberg U.S. Aggregate Index
Morningstar Category
Intermediate Core-Plus Bond
Fund Symbol
THCCX
Share Class
C
Share Class Inception Date
2 Oct 2023
Distribution Frequency
Monthly
30-Day SEC Yield (Subsidized)
3.67%
30-Day SEC Yield (Unsubsidized)
1.97%
Annualized Distribution Yield
4.29%
Characteristics
Characteristics
Portfolio
(As of 31 Mar 2026)Portfolio
Benchmark
Number of Holdings
319
—
Annual Portfolio Turnover
33%
—
Effective Duration
6.1 Yrs
5.8 Yrs
Average Effective Maturity
7.8 Yrs
8.1 Yrs
Portfolio
Benchmark
Weighted Average Coupon
3.9%
3.8%
Yield to Worst
5.3%
4.6%
30-Day SEC Yield (Subsidized)
3.67%
—
30-Day SEC Yield (Unsubsidized)
1.97%
—
Portfolio
Portfolio
Top Holdings
(As of 28 Feb 2026)Name
Ticker/Symbol
Weight %
United States Treasury Note/Bond
91282CPJ4
6.2
United States Treasury Note/Bond
912810RT7
2.6
United States Treasury Strip Coupon
912834KV9
2.3
United States Treasury Note/Bond
912810SQ2
2.3
United States Treasury Strip Coupon
912834MD7
1.8
United States Treasury Strip Coupon
912834NP9
1.7
Fannie Mae Pool
31418ECQ1
1.6
United States Treasury Note/Bond
912810ST6
1.5
Fannie Mae Pool
31418EBS8
1.5
United States Treasury Inflation Indexed Bonds
912810SV1
1.4
Exposure Breakdown
Exposure Breakdown
(As of 31 Mar 2026)Sector Allocation
Fund (%)
Corporate Bond
33.2
Treasury Domestic
20.2
Mortgage Passthrough
13.5
Collateralized Mortgage Obligation
12.5
Asset Backed Securities
11.3
Commercial Mortgage Backed Security
5.0
Short-Term Investments, Other Assets & Liabilities
1.5
Preferred Stock
1.4
Treasury-Foreign
1.3
Municipals
0.1
Top 10 Countries
Fund (%)
United States
88.2
Mexico
1.9
United Kingdom
1.8
Canada
1.2
Saudi Arabia
0.8
France
0.7
Bermuda
0.6
Uzbekistan
0.6
Brazil
0.6
Guatemala
0.4
Credit Quality
Fund (%)
U.S. Government
39.0
AAA
12.0
AA
3.7
A
10.3
BBB
18.5
Below Invest. Grade
10.0
Not Rated
4.9
Short-Term Investments, Other Assets & Liabilities
1.5
Maturity
Fund (%)
Year 1
10.0
Year 2
7.5
Year 3
10.2
Year 4
9.5
Year 5
6.8
Year 6
6.3
Year 7
2.4
Year 8
3.0
Year 9
2.6
Year 10+
40.2
Short-Term Investments, Other Assets & Liabilities
1.5
Portfolio Managers
Portfolio Managers

Lon Erickson, CFA
Portfolio Manager and Managing Director
Lon Erickson is a portfolio manager for Thornburg Investment Management. He joined Thornburg in 2008 and was named a managing director and was promoted to portfolio manager in 2010. Prior to joining Thornburg Investment Management, Lon spent almost 11 years as an analyst for State Farm Insurance in the equity and corporate bond departments. Lon earned a bachelor’s degree in…
Learn More

Christian Hoffmann, CFA
Head of Fixed Income, Portfolio Manager and Managing Director
Christian Hoffmann is head of fixed income and a portfolio manager for Thornburg Investment Management. He joined the firm in 2012 as a fixed income analyst and was promoted to associate portfolio manager in 2014. Christian was named a managing director in 2017, was promoted to portfolio manager in 2018, and to head of fixed income in 2024. Prior to…
Learn More
More Insights

Markets & Economy
A Disinflationary Paradox of High Oil Prices
A look at how sustained high oil prices act as a drag on demand, shifting inflation lower over time and echoing signals from an inverted yield curve.
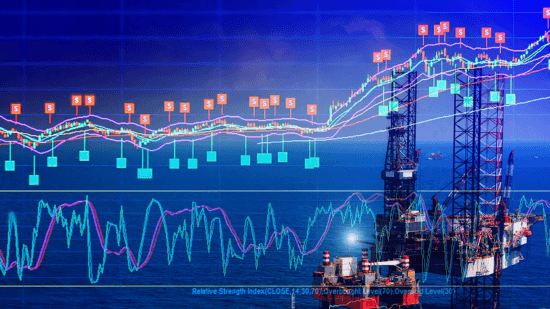
Markets & Economy
Oil Shock Hits Different in a World of Shrinking Petrodollars
With petrodollar recycling diminished, oil spikes act like funding shocks. See which markets are vulnerable and where bottom up resilience may win.

Markets & Economy
Global Markets Amid the Energy Shock: Policy, Inflation, and Opportunity
Global energy shocks are reshaping inflation, central bank policy, and markets. Explore what higher oil prices mean for growth, rates, and global equities.

Real Estate
Navigating Supply, Rates, and Opportunities in Real Estate
We break down competitive advantages in private real estate and how macro dynamics — from tariffs to AI infrastructure — are reshaping the investment landscape for sophisticated allocators.

Global Equity
Structural Forces Are Reshaping the Investment Landscape
Shifts in technology, geopolitics, and capital costs are changing how risk is priced and how portfolios behave.

Risk Management
When Geopolitics Drive Volatility: An Active Approach to the Iran Conflict
Geopolitical tensions have sparked market volatility, but historic parallels suggest a potential opportunity for active strategic positioning.