
The popularity of electric vehicles is a turning point for the auto industry. Thornburg has identified sustainable catalysts helping to drive this trend.
Summary
- The evolution of the automotive industry is accelerating as the popularity of electric vehicles spreads. Through our research, we see strong indications that electric vehicles will be poised for sustained growth over the next decade.
- We believe there are key catalysts that will drive this electrification trend globally—lower battery costs, improved battery cell technology, increased government regulations of CO2 emissions, and changing consumer preferences for more safety and automation features.
- The shift toward electric cars will bring new and exciting investment opportunities across a broad range of industries and companies. In our view, suppliers of key cathode materials and auto semiconductor companies deserve a closer look as some of the biggest beneficiaries of electric vehicle growth.
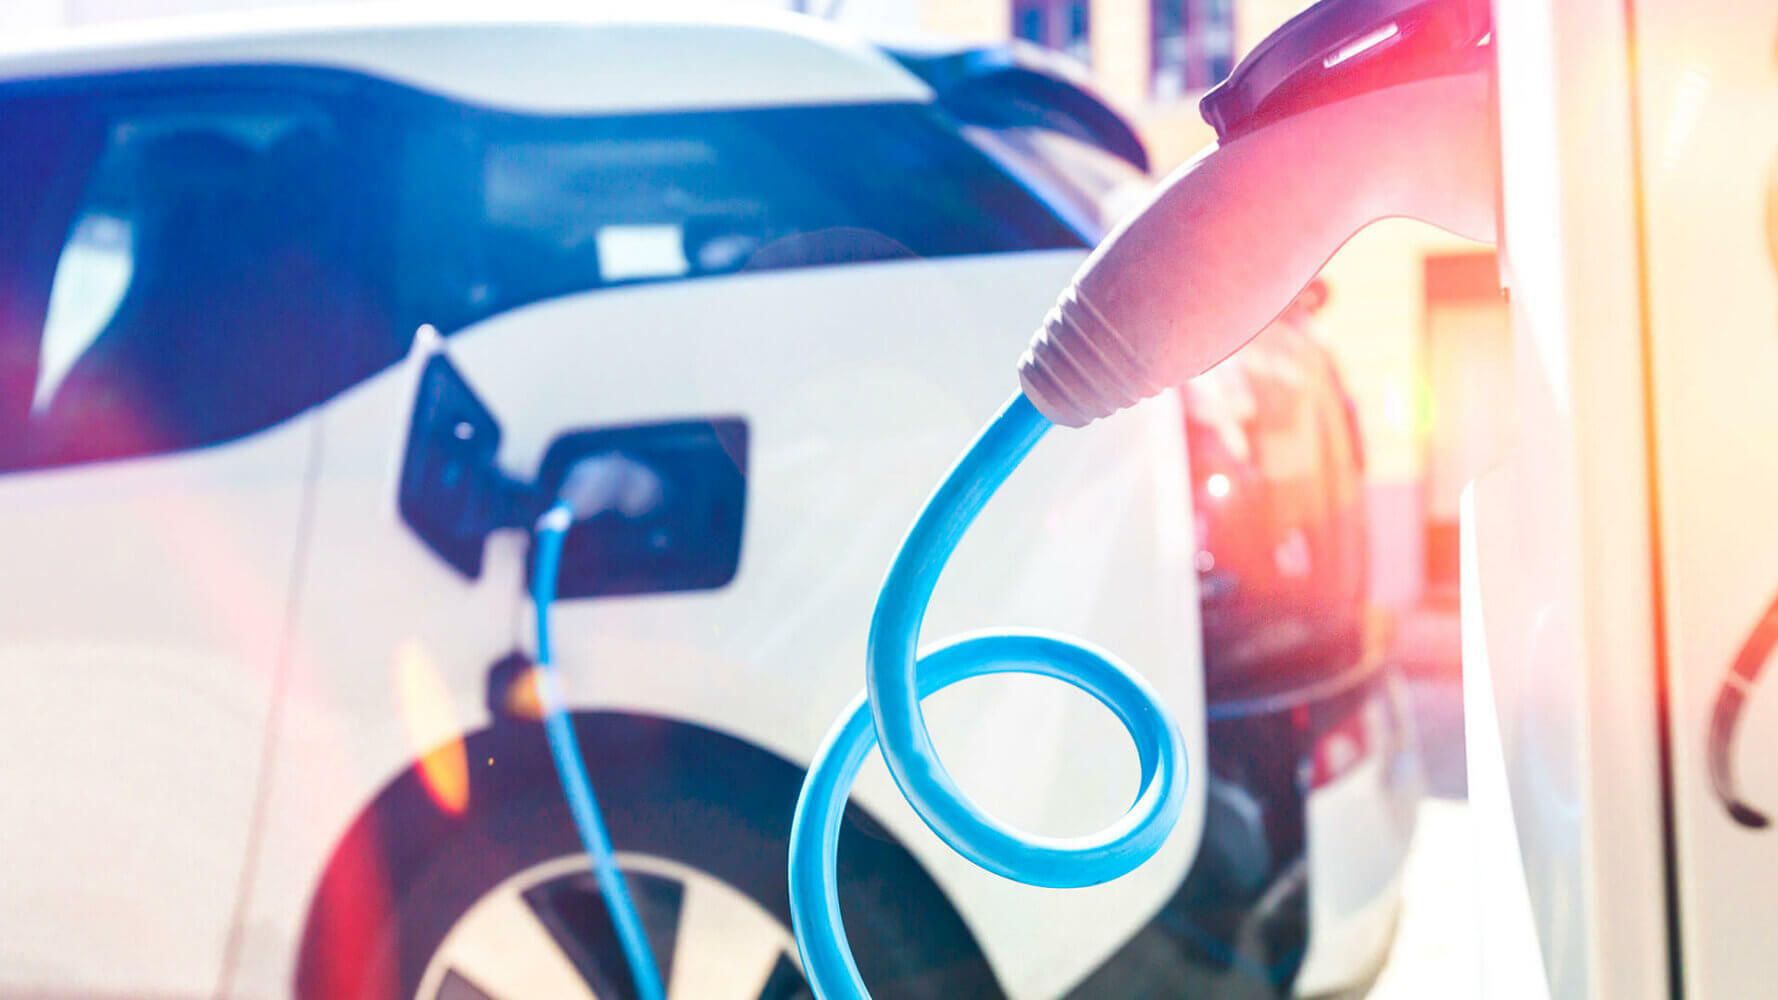
The transition from conventional cars to the car of the future is finally here. The electrification of transport is now one of the major trends in the car automation world, directly impacting auto manufacturers, auto part providers, and other key suppliers in the electric vehicle ecosystem. In this paper, we take an in-depth look at the investment case for the electric vehicle market by evaluating the opportunities and risks created by new disruptive technologies that are reshaping the world of personal transportation. No technology transition follows a smooth path—so let’s buckle up as we embark on this road trip to the future.
Electric vehicle growth poised to accelerate into 2030
Despite years of sluggish growth, dozens of new fully electric competitors are entering the marketplace. Electric vehicles [EV] and advanced driver-assistance systems [ADAS] are now seeing rapid adoption driven by a combination of government policy, consumer preferences, climate considerations, and disruptive innovation that has improved overall affordability and product quality. As an example, existing and anticipated regulations relating to CO2 emissions are pushing consumers and manufacturers to adopt EVs. Europe leads the way, with a recently announced ban on the sale of ICE (internal combustion engine) vehicles by 2035. All of these factors are happening concurrently, contributing to a tidal change that will favor robust EV growth ahead.
Going forward, Thornburg estimates that EV sales will reach approximately 30% of new vehicles sales by 2030 with a total fleet size of 200 million units, as seen in Figure 1. Given the new car market is worth roughly $2 trillion, both debt and equity markets have taken notice, and valuations of leading EV auto manufacturers have skyrocketed. This transition will not only impact traditional auto OEMs (original equipment manufacturers), but will also have a beneficial impact on a broad range of industries across different sectors, creating additional investment opportunities throughout the EV supply chain.
Figure 1: Electric Vehicle Sales Scenario Analysis
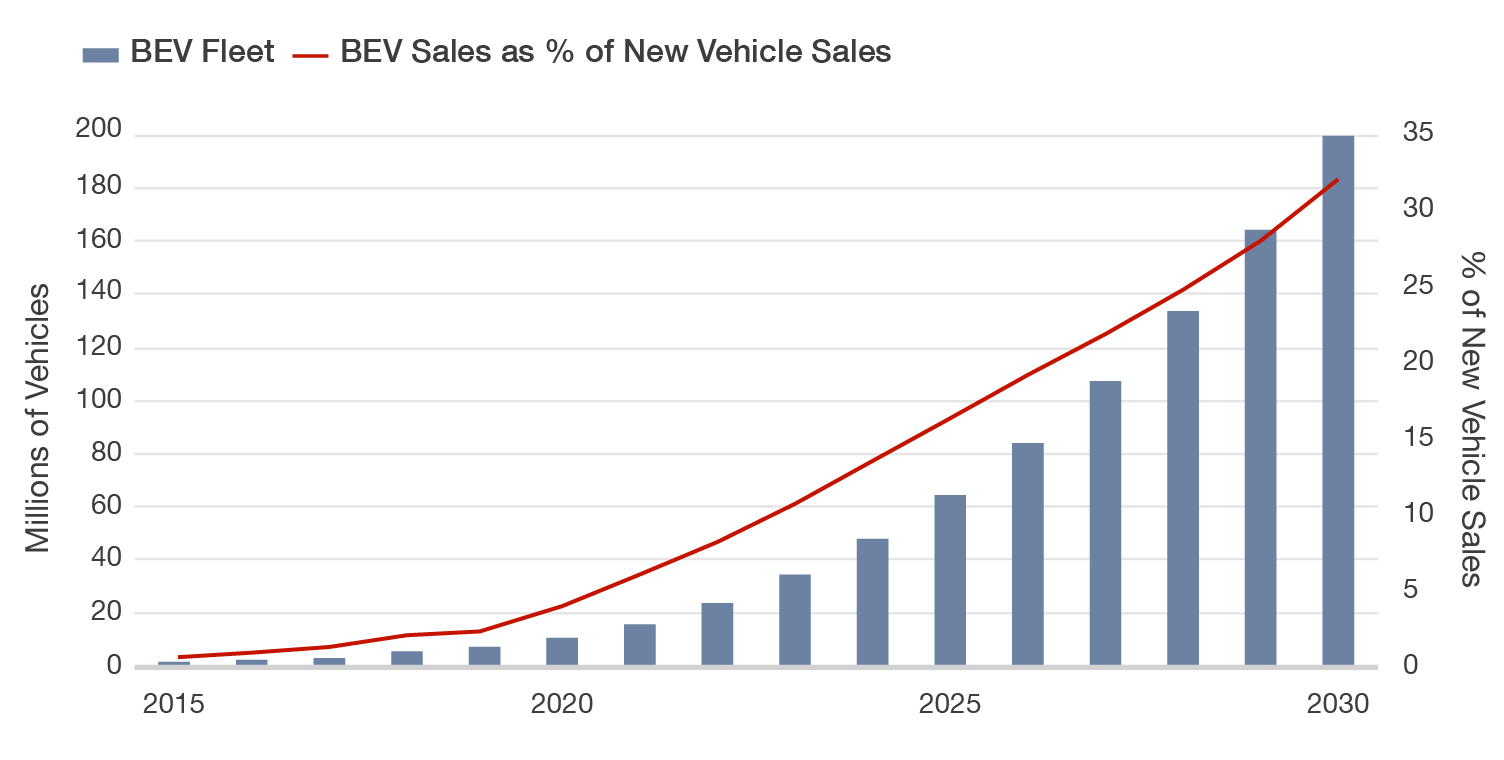
Source: Thornburg Investment Management as of June 25, 2021
The steep rise in projected EV sales has led many investors to look at OEMs as potential beneficiaries initially. For the first time in decades, dozens of EV competitors are entering the market and nearly all of the largest traditional automakers have announced plans to build out EV cars to stay relevant. The combination of new entrants and traditional OEMs fighting to maintain their position has led to massive capital deployment, which has led OEM companies to raise significant sums of capital to meet spending needs. However, it is unclear to us whether the return on capital from these capital investment undertakings will pay off. The global auto market has been barely growing over the past several years and is projected to grow at a fairly sluggish pace (estimated 1% CAGR) through 2030. With more spending and slow-growing revenues, overall industry return on capital seems likely to fall. Despite the increasingly challenging landscape and uncertain return outlook for OEMs, valuations for leading EV makers are in “ludicrous-mode”, as the market is expecting the leaders to capture an outsized share of auto profits. While we feel confident about the growth of EVs in general, identifying specific OEMs that will grow into their lofty valuations will be more challenging. Fortunately, disruptions in the EV space have provided many alternative investment opportunities and we see clear catalysts that will support the overall EV growth trajectory.
Key catalysts driving electric vehicle adoption
We believe there are many indicators that suggest EV adoption is at a tipping point and there will be rapid adoption of electric vehicles over the next few years. Key factors that will drive this trend include battery cell innovation and cost improvements, and changing consumer preferences for more safety and automatic driving features.
Catalyst #1: Decreasing battery costs and improving battery range
Battery costs are one of the largest incremental expenses relative to traditional internal combustion engines (ICE) used in conventional cars, and have fallen over 18% per year for the past decade due to increasing manufacturing scale and technological developments, as seen in Figure 2. Furthermore, battery range is also improving, which has greatly reduced consumers’ anxiety over driving long distances in electric vehicles. For example, from 2010 to 2020, the average driving range increased from 84 miles to 256 miles per charge. This is made possible because technological advances are bringing new chemistries to market which have a longer range than the batteries used previously.
Figure 2: Cost structure of different car types
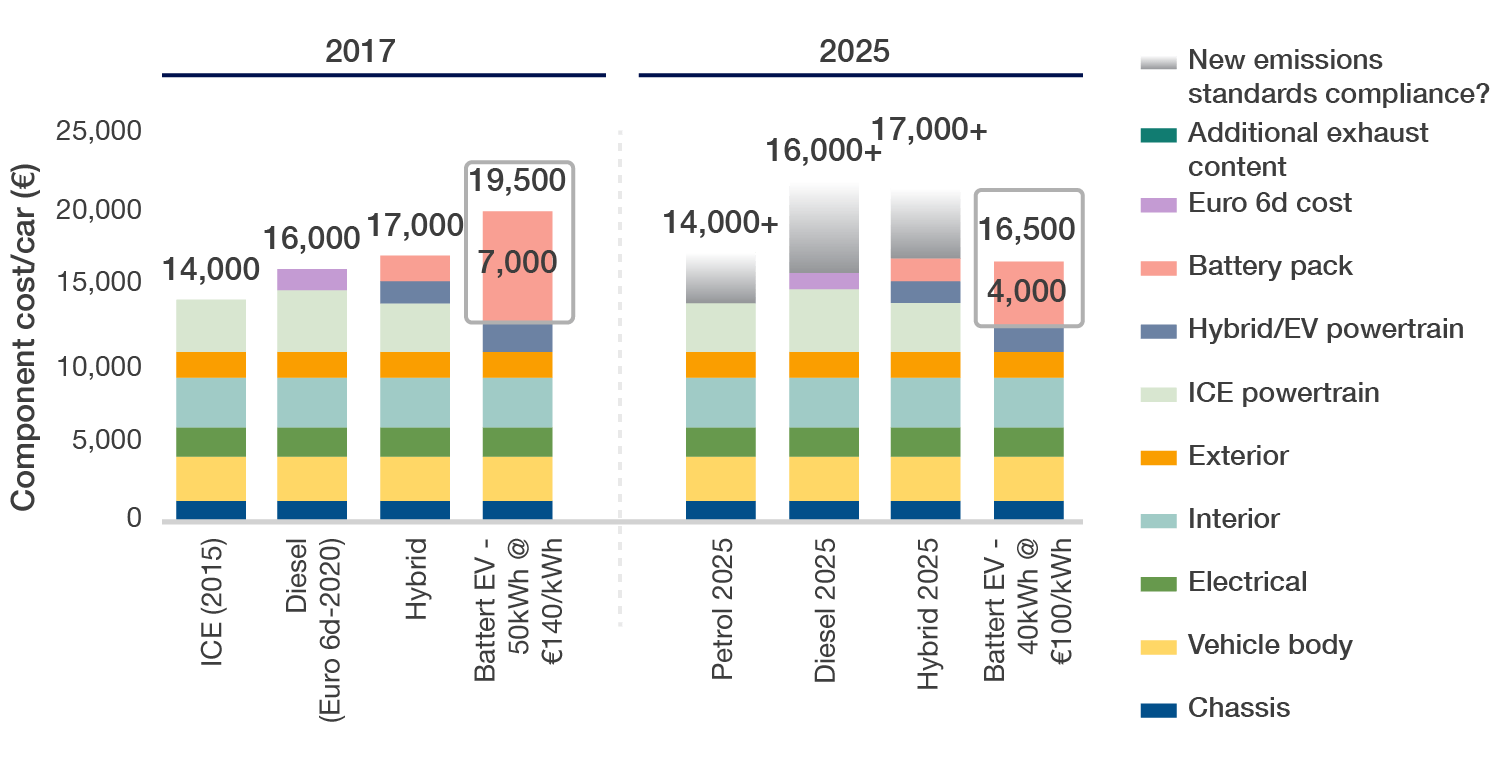
Source: Morgan Stanley Research and Thornburg Investment Management as of February 20, 2019
In the case studies below, we’ll take a deeper dive into the latest developments in the chemistries that go into battery design choices and what those mean for companies that supply these chemistry components.
Case study #1 – Transition to higher nickel cathodes in battery design
Due to the level of market consolidation that has occurred, battery manufacturers have received a lot of promising attention and have seen their valuations increase. As of today, there are four main cathodes used or under development for EVs, as seen in Figure 3 below. Cathodes are a crucial part in battery construction as it facilitates the flow of electrons needed to generate conductivity of electricity. The type of material used in the cathode also plays an important role because it determines the battery’s overall capacity and voltage. The cathodes listed in Figure 3 each have unique material compositions, characteristics and challenges that must be considered by design teams. Most battery makers are aligning themselves with one of these technologies and spending significant capital and R&D to develop it.
Figure 3: Cathodes used in battery design
| LFP Batteries | BYD |
|
| High Nickel
(NCM811–NCA) |
Tesla |
|
| Low Nickel
(NCM111–NCM622) |
CATL |
|
| Next-Gen Batteries
(Li-Air, Li-Metal) |
QuantumScape |
|
Source: Thornburg Investment Management
The most popular cathode used outside of China today is the low nickel option (i.e. NCM433 comprising 40% nickel, 30% cobalt, and 30% manganese), which has been in use for the past two decades. The trend has been to substitute the more expensive and ethically challenging cobalt, as well as manganese, for nickel. This trend not only reduces the material input cost to the cathode, but also increases the power density.
As a result, the cathode that started as equal parts nickel, cobalt, and manganese has shifted toward the newer high nickel grouping. High nickel cathodes like NCM811 (80% nickel, 10% cobalt, 10% manganese) or NCA (nickel, cobalt and aluminum, mainly used by Tesla) are starting to be adopted in many high-end EVs as they have the highest power density of the chemistries today. While these batteries are still slightly more expensive than their lower nickel counterparts, the cost is falling fast as manufacturers start to produce at scale. Given the input costs are significantly lower and the power density is better, the higher nickel batteries should replace the lower nickel by the middle of the decade.
While the shift from low to high nickel cathodes is clear, there is some uncertainty around just how strong market penetration can be for higher nickel cathodes. This is due to the fact that China is currently the world’s largest auto and EV market, and the dominant cathode they use is LFP, which is comprised of lithium, iron, and phosphate rather than nickel and cobalt. Thus, nickel and cobalt could face significant substitution risk if LFP successfully overcomes its power density hurdles and wins the cathode market share. Furthermore, solid-state batteries, like the ones used by QuantumScape, promise to be both cheaper and more energy dense than any form of chemistry today. If solid-state batteries could be successfully commercialized and become cost competitive, then they could become the mainstream chemistry and win the cathode market share as well. In our view, battery makers will not be the only ones affected by which form of chemistry wins; we also see potential opportunities for mineral miners that provide these key cathode materials as demonstrated in case study #2.
Case study #2 – Green mineral miners of lithium and copper show promise
As seen in Figure 4, we expect all the key inputs in batteries to grow significantly in the next decade, but which chemistry wins out will have an outsized impact on the demand for specific materials. Currently, lithium, cobalt, and nickel are three key green minerals used within the cathode. However, the attractiveness of cobalt and nickel may be under pressure and face risk of replacement.
As an example, players across the EV landscape are trying to reduce the amount of cobalt used in the cathode due to notable ESG hurdles to overcome. Seventy percent of global cobalt production today comes from the Democratic Republic of the Congo, where child slavery and other human right abuses are common. Additionally, lax environmental regulations have led to significant degradation of the local landscape, which is something many EV buyers are hoping to avoid. LFP and solid-state batteries do not use cobalt, thus increasing their appeal to EV players. Both LFP and solid-state batteries would also eliminate the demand for nickel, which has seen significant price increases in the past few years. Going forward, some auto OEMs have mentioned that they are nervous about nickel and want to see more alternative chemistries made available to reduce the dependency on the material. As a result, both cobalt and nickel face significant substitution risks, if nickel cathodes are replaced.
This is where lithium stands out. In any chemistry combination used, there is little variation in the amount of lithium that is used. Given the reliability of lithium being a critical mineral, miners are rushing to expand their lithium production capacity. Over the next five years, Bloomberg expects the production of lithium to surpass 1.6 million metric tons, far outpacing cobalt, manganese, and even nickel. Additionally, the EV market currently contributes roughly 70% of the demand for lithium, and the EV market is projected to grow to over 90% by 2030. Thus, despite the additional production, our own estimates show that lithium supply will still fall short due to the surge in EV demand, presenting investment opportunities in this space.
Figure 4: Projected demand for key cathode minerals
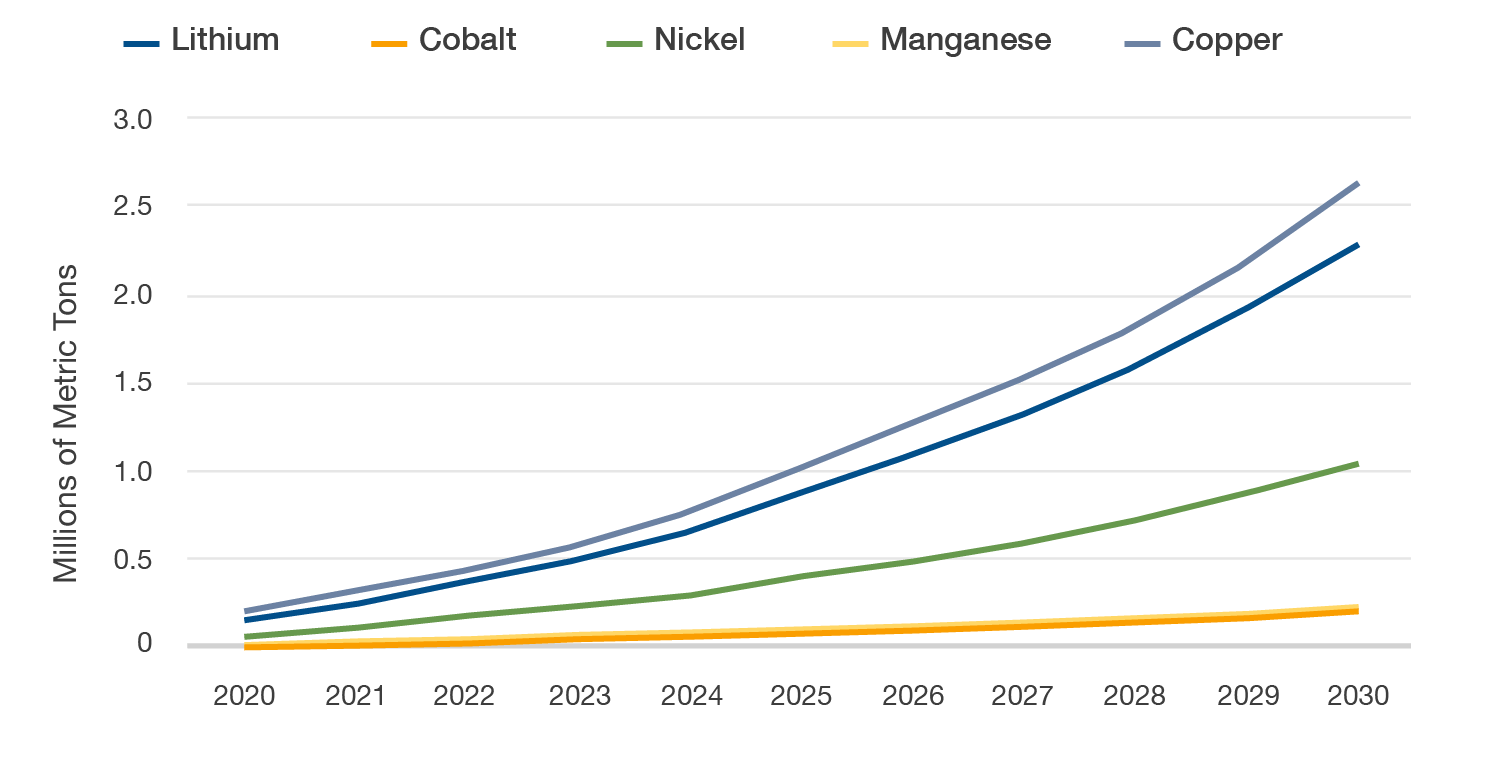
Source: Thornburg Central Research, as of 6/25/21
Copper also shows much promise. Copper is used in the electrical wiring within the car and the charging infrastructure. Today, green materials represent only 3% of the total copper demand, but we expect this to increase to 17.5% of demand by 2030. At the same time, copper production takes years to come online, with new mines taking between five and seven years to open. As a result, the shortage we are projecting, starting in 2025, requires new projects to break ground today. Through our research, we have found little evidence of this occurring. Thus, copper will be another resource that may experience a significant shortfall, presenting further opportunities for investors.
Catalyst #2: Demand for more safety features and driving automation
Electric vehicle demand has also spilled over to the demand for more advanced driver-assistance systems (or ADAS). The degree of automation is typically organized into different levels, as seen in Figure 5, with features ranging from no automation (L0) to including driver assistance features like blind-spot monitors, and all the way to fully self-driving vehicles (L5).
Figure 5: Varied levels of driving automation
| Level of Driving Automation | Degree of Autonomy | Example of Features | Need for Human Internvention | ||||||
| L0 | NO AUTOMATION |
|
HUMAN MONITORS DRIVING ENVIRONMENT | ||||||
| Manual control. The human performs all driving tasks (e.g. steering breaking acceleration, etc.) | |||||||||
| L1 | DRIVER ASSISTANCE |
|
Driver monitors the environment, even when automation features are on | System supports the driver | Steering OR speed are automated | ||||
| The vehicle features a single automated system (e.g. monitors speed through cruise control). | |||||||||
| L2 | PARTIAL AUTOMATION |
|
Steering AND speed are automated | ||||||
| The vehicle can perform steering and acceleration. The driver still monitors all tasks and can take control at any time. | |||||||||
| L2+ | PARTIAL AUTOMATION |
|
|||||||
| Vehicle can perform steering and acceleration, with quasi auto-pilot, but driver always alert/responsible and hands near wheel. | |||||||||
| L3 | CONDITIONAL AUTOMATION |
|
Driver takes control when system requests | System operates when specific conditions are met | AUTOMATED SYSTEM MONITORS DRIVING ENVIRONMENT | ||||
| Vehicle performs most driving tasks, but human override still required. OEM liable aside from when driver warned to take over (subject to grace period.) | |||||||||
| L4 | HIGH AUTOMATION |
|
Driver not required to take over control | ||||||
| The vehicle performs all driving tasks under specific circumstances. Human override is still an option. | |||||||||
| L5 | FULL AUTOMATION |
|
System operates in all conditions | ||||||
| The vehicle performs all driving tasks under all conditions. Zero human attention or intervention is required. | |||||||||
Source: Goldman Sachs
Consumer preferences have also evolved due to increased regulations around car safety. For example, in 2018, the Cameron Gulbransen Kids Transportation Safety Act required all new vehicles in the US to include backup cameras to increase safety. This new requirement prompted many consumers to demand that even more safety features be added. As a result, in 2020 more than five million cars were sold with Level 2+ features and that demand is expected to rise further, as seen in Figure 6.
Figure 6: Increased demand for Level 2+ automation features through 2030
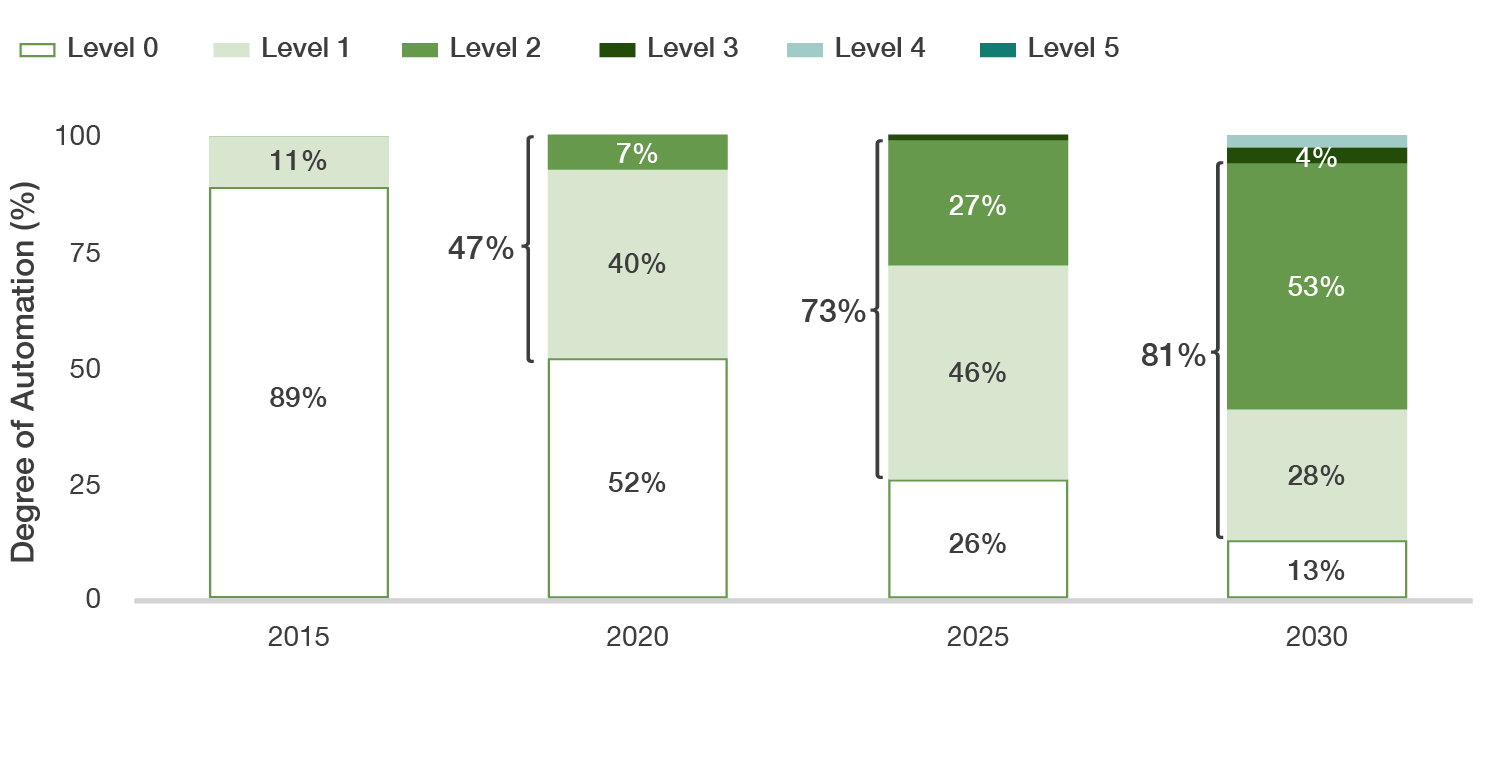
Source: Strategy Analytics: Metrix Live. December 2019; L2 includes L2 and L2+
There will be growth in auto semiconductor companies. As seen in Figure 7, with each incremental automation level comes the need to develop additional technologies such as sensors, radar systems, and cameras, but more importantly, the semiconductors that control these. Consequently, the average electric vehicle uses about twice the amount of semiconductor components compared to a conventional vehicle. One particularly fast-growing area is the battery management systems used to optimize battery usage, and this industry is growing at a 60% compound annual growth rate (CAGR) according to one industry leader. Thus, leading auto semiconductor companies that can compete in both battery management systems, as well as ADAS, will be poised to experience the most growth. In total, the automotive semiconductor industry is expected to grow at an 11% CAGR through the rest of the decade to a $110B industry driven by the demand for additional semiconductor content in electric cars.
Figure 7: More automation will drive demand for more semiconductor parts
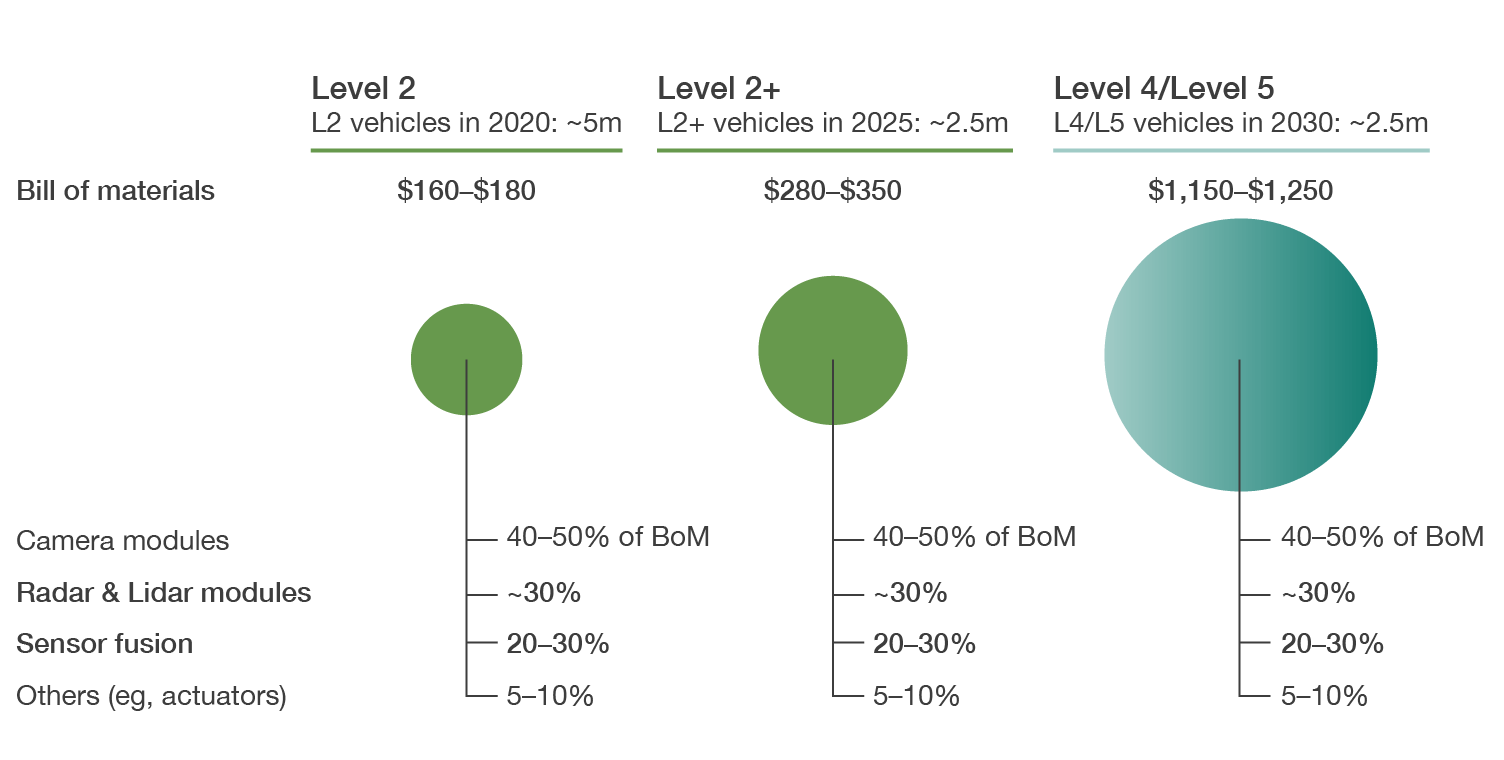
Source: Strategy Analytics: Automated Driving Semiconductor Market Estimate. August 2020; Infineon
BoM contains all type of semiconductors (e.g. radar modules include μC); sensor fusion does not include memory.
BoM are projected figures for the respective time frame.
Conclusion
We believe that the movement toward electrifying vehicles will continue to be supported by both technological innovations, as well as consumer preferences toward electric vehicles. The race among the supply-side companies to provide the best technology is too close to call, but the overall trend remains compelling for investment in companies that are able to become critical participants in this space.
Our global generalist investment framework is well suited to identifying these types of opportunities which require “connecting dots” across sectors and geographies, like the disruptions happening in the automotive supply chain today. While it remains to be seen what the long-term outcomes of the EV disruptions will bring, we will be prepared to ask the right questions and follow the data toward the best opportunities.
Discover more about:
Related Content

More Insights

Considering the Cost of Future Growth

What’s Driving Equity Returns?

Thornburg Income Builder Opportunities Trust Announces Distribution
Don’t Wait for the All Clear
Thornburg Extends Income Builder Franchise with Launch of THOR ETF